Chatting about reconstructing 1 billion years of Earth evolution in Geology Bites podcast
This post is based on a podcast with Oliver Strimpel from GeologyBites. We discuss the motivation, challenges and benefits of reconstructing Earth evolution over a billion years. Oliver Strimpel, who runs GeologyBites, is former astrophysicist and museum director, and Visiting Professor at the Department of Earth Sciences at Oxford University.
OS: The theory of plate tectonics has been widely accepted for about fifty years. It tells us that the surface of the Earth is composed of about a dozen rigid plates that are in constant motion. There are two basic plate types – oceanic plates that are continually being created at mid-ocean ridges and destroyed at subduction zones, and continental plates that are formed from material distilled out from melted mantle rocks. But understanding the processes that drive plate tectonics does not tell us the actual history of plate motions, plate formation, and plate destruction that has taken place. Dietmar Müller is Professor of Geophysics at the University of Sydney. He is interested in combining the wealth of very disparate geological and geophysical data that is available into a self-consistent picture of the Earth’s history over deep time. Over the past decade, his group have completed the herculean task of building just such a model spanning a full billion years of Earth history. Dietmar Müller, welcome to Geology Bites.
DM: Thanks for having me. Geology Bites sounds like a cousin of our research group here in in Sydney, called EarthByte.
OS: How did the idea of reconstructing the motions of the Earth’s plates over hundreds of millions of time come about?
DM: The fifty-year-old theory of plate tectonics merely explains how plate tectonics works, not how plate motions evolved through time, across cycles of supercontinent assembly, breakup and dispersal. The rise of computing in the 80s and 90s made it possible to apply the theory of plate tectonics to the actual evolution of the Earth.
OS: One of the challenges of building such a model is that the sources of data are very heterogenous. What kinds of sources did you use?
DM: The data we use differ depending on how far back in time we are going. Most of the preserved ocean floor is younger than 170 Ma in the Late Jurassic. Ocean floor is the best constraint for modelling plate motions because it contains magnetic stripes visible in the Earth’s magnetic field. Ocean crust is like a giant tape recorder while it is being created at mid-ocean ridges, recording reversals in the Earth’s magnetic field. Together with oceanic fracture zones, which encode the spreading direction, we can use magnetic field data to make fairly accurate models of plate motions through time. But reconstructing pre-Jurassic ocean floor, or younger ocean floor that’s been subducted is much harder. The same goes for figuring out the motions of terranes in complex regions, like the Caribbean or parts of Southeast Asia. For this we need to compile a diversity of geological and geophysical data to assess the geological affinities of different terranes and continents through time, pretty much like Alfred Wegener did when he developed the theory of continental drift, but using digital data bases. These data include structural, petrological, paleontological, stratigraphic and age constraints from regional geology. We also track their latitude of terranes using paleomagnetic data.
OS: That’s a very wide-ranging and disparate set of data. How did you manage to wrangle them all into a self-consistent model?
DM: Going back in time, less and less of the geological record is preserved. In order to generate complete global plate tectonic maps, we need to interpolate between what’s preserved. The biggest hurdle we faced was not actually the incompleteness of the data, but having software that allows a user to reconstruct not only the plates, but also their boundaries through time. One of the basic rules of plate tectonic theory dictates that all plate boundaries must be connected. The further one goes back in time the more gaps will open up in the plate boundary system, because so many portions of previously existing mid-ocean ridges or subduction have now vanished. We needed software that would allow us to reconstruct a continuously evolving network of tectonic plate boundaries through time, including mid-ocean ridges, transform faults and subduction zones, even though data are patchy, using the rules of plate tectonics. This is why we developed our GPlates software, which can “cookie-cut” all geodata, our expression for assigning them to tectonic plates, and rotate them back through time. GPlates is also designed to deal with the concept of “continuously closing plate boundaries”, meaning the reconstruction of complete mosaics of plate boundaries through time. When developing continental drift theory, Wegener was unaware of the existence of plate boundaries. Plate tectonic theory clarified how plate boundaries work, but without GPlates, we would have not been able to develop the global deep-time plate models we now have. My long-time collaborator Mike Gurnis at Caltech played a huge role in developing this functionality.
OS: I can see it’s an immensely complex and, in some ways, messy problem. Was one of G-Plates main roles to help handle the complexity while enforcing global self-consistency of the model?
DM:GPlates is designed to enforce the rules of plate tectonics, e.g., we can ensure that plates do not exceed their plate speed limits, that no quadruple junctions between plates exist, GPlates also ensures that the Earth is not expanding or contracting, and allows us to ensure that the entire shell of Earth does not rotate at unreasonable speeds, something called net rotation.
OS: Why no quadruple junctions?
DM:Quadruple junctions are places where four plates would come together. When plate tectonic theory was developed it was shown that they are unstable and thus merely exist for fleeting moments of geological time, if at all.
OS: Does G-Plates assemble a purely 2-dimensional jig-saw puzzle of a global spherical shell over time?
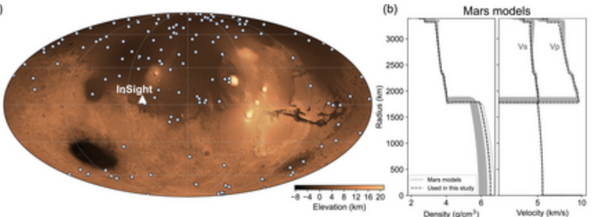
DM: Observations of sinking slabs from seismic tomography are becoming integrated into these models and are used to constrain the location of subduction zones, especially for intra-oceanic subduction where little other information can be used to reconstruct their location. Seismic tomography works like an ultrasound system, but using seismic waves generated during earthquakes. These waves travel through the mantle, cross subducted, sinking slabs, which accelerate the waves, and are eventually recorded somewhere. A large set seismic wave travel times can be used to generate images of subducted slabs in the mantle, and assuming they largely sink vertically, and roughly knowing their sinking speed (1-2 cm/yr), we can then infer the surface location of subduction zones through time.
OS: Despite your ability to integrate such a diversity of evidence as to the history of the plates, are there gaps or inconsistencies in the data, such that, as you go back in time, or for a certain interval in time, where the model just remains very uncertain?
DM: The model of the positions of the continents is still reasonably well-constrained because of the wealth of geological and continental paleomagnetic data we have. But it becomes much harder to reconstruct the ocean basins before 170 Ma. Ocean basins fall in different categories. Oceans that are complete surrounded by subduction zones and have no preserved ocean floor are close to impossible to reconstruct. All one can do is generate simple end-member scenarios for what they might have looked like, using existing oceans like the Pacific as a guide. Then there are oceans that have a subduction zone on one side, and a passive continental margin on the other. This was the case for the Tethys ocean, separating the ancient continents of Gondwana and Laurasia. In this ocean terranes were rifted off Gondwanaland, crossed the entire ocean basin and were eventually accreted to Laurasia. These terranes are very handy as their geological and paleomagnetic data allow us to reconstruct the creation and destruction of ocean basins during their passage across the Tethys sea.
OS: OK, but then even with the benefit of your G-Plates software, were there time intervals when the data appeared to be wrong or inconsistent such that you just could not generate a self-consistent picture?
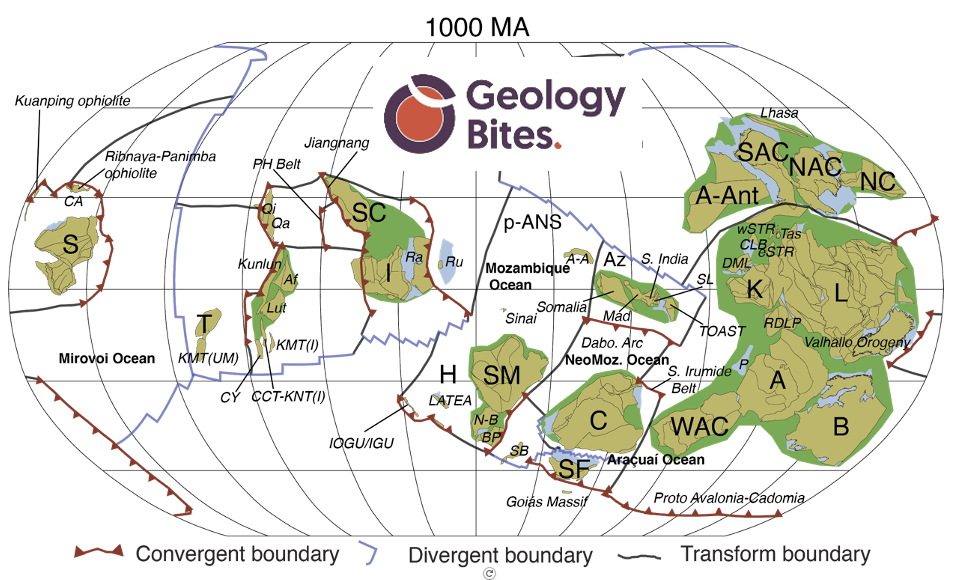
DM: At pre-Pangea times, reconstructing the supercontinent Rodinia is challenging? The magnetic polarity timescale is not well known far back tin time? Sometimes we don’t even know the hemisphere of a block or terrane; then we need to use geology and deductive reasoning, trial and error, the motion history of plates through time, and the constraints from the plate-tectonic rules I mentioned earlier.
OS: You and your colleagues finally published your billion-year model in February of 2021. Can you estimate how many separate geological studies were incorporated into this model and how many man-years of work went into it?
DM: The paper has nearly 500 references, and many of these papers would in turn be summaries of other papers, so I’d say that it’s easily over 1000 geological studies that form the basis of this paper, conducted over half a century. The woman and man hours of work on part of everyone involved are hard to estimate. Several thousand hours for sure. It’s so labor intensive because the process of generating the model involves a lot of decision making, when it comes to connecting plate boundaries in the face of sparse data, or reviewing alternative positions of the plates. It’s not yet possible to teach a computer to do this work. The bulk of this work was done by my ex-student Andrew Merdith, who led the entire effort over a period of 4 years. The work would not have been possible without Alan Collins from Adelaide Uni and his group of students – they are experts in geological data sets constraining the Paleozoic and Neo-Proterozoic reconstructions, and have done field work across Gondwana continents that are critical to understanding plate tectonic evolution during these early time intervals, from Australia to India, Madagascar and Africa.
OS: The result is a truly mesmerizing video showing the plate motions as well as the nature of the plate boundaries - spreading ridges, subduction zones, and boundaries where the plates just slide past each other. The video is posted on the podcast web page. Do you know how many people have watched the video?
DM: It had a big impact. The video has been viewed over 2 million times on youtube. If you haven’t seen it I highly recommend watching it. It provides a view of the dynamic Earth through time unlike anything you would have seen before. You’ll see an ever changing web of plate boundaries enclosing shifting continents and growth and destruction of ocean basins. People often think the Earth should naturally stay the way it was when they were born, or perhaps the way it was 100 years ago. Instead, driven by plate tectonics, the Earth system has been a story of dramatic change, with multiple cycles of supercontinent assembly and dispersal, linked to long-term environmental change.
OS: Just seeing this magisterial overview of the planet’s tectonic motions through time satisfies our historical curiosity. But this must have far-reaching implications for geoscience beyond that.
DM: It connects many aspects of geology and climate: the making of orogenic belts, volcanic arcs, continents, ocean basins through greenhouse and icehouse climates. The plate model will enable the integration of digital elevation models and climate models—including changes in rainfall and rock weathering and carbon cycling through time. This will establish an entirely new, holistic approach to deep-time Earth system modelling, allowing us to gain insights into how Earth’s tectonic cycles regulate the concentration and availability of essential elements in the atmosphere and oceans responsible for modulating climate and biological evolution.
OS: It’s clear that continental collision zones will make mountain belts, subduction zones will create volcanic arcs, spreading ridges will create ocean basins. But let’s talk about some of the other implications you mentioned. How does your grand historical synthesis to throw light on processes in the deep Earth?
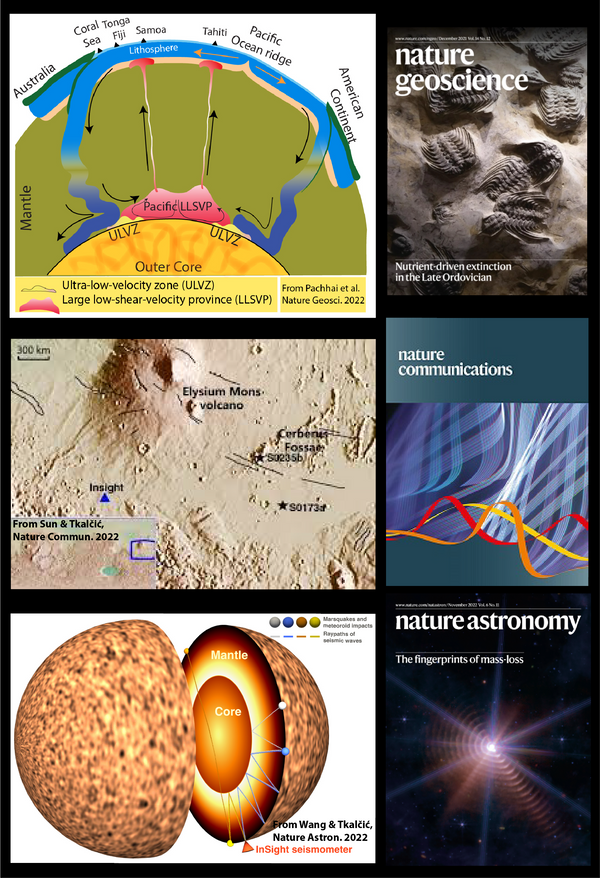
DM: Subduction of oceanic plates stirs the mantle. Subducted plates can sink all the way to the core mantle boundary, where they pile up and ultimately give rise to mantle plumes, cylindrical upwellings of mantle material that cause giant volcanic eruptions when they reach the surface. These so called large igneous provinces are knows to play a role in driving mass extinctions. The most famous example are the so-called Siberian Traps. They erupted around 250 million years ago and caused an event also known as “The Great Dying”. It is the Earth's most severe known extinction event, with around 81% of all marine species and 70% of terrestrial vertebrate species becoming extinct. It was the largest known mass extinction of insects. Coupled models of tectonic plate motion and mantle convection over a billion years allow us to study how the subduction history at the surface is linked to processes at the core-mantle boundary, and the triggering of plume formation events. We are already running these sorts of models, and have found that that may take between 160‐240 Myr for the lower mantle structure to start reflecting plate motion changes at the surface so there are some large time delays involved, and if a plume forms deep in the Earth it may take another few tens of millions of years to arrive at the surface. That’s why we need to run these models over many hundreds of millions of years to understand the connections.
OS: The model shows that about 100 million years ago in the mid-Cretaceous there was a surge in the volume of ocean slab material that was subducting. Did this have consequences we can observe?
DM: There was a period of “slab superflux” into the mantle in the Early Cretaceous, peaking around 130 Ma. The spike reflects a two-fold increase in mid-ocean ridge lengths following the break-up of Pangea, and a coincident increase in convergence rates, with average speeds exceeding 10 cm/yr. This is pretty fast as far as plate tectonics goes, as plates normally move at the speed at which fingernails grow, which is more like 2-5 cm/yr. This slab superflux drove a surge in slab penetration into the lower mantle and an associated increase in the vigour of mantle return flow – for everything that goes down something has to come up. This mid-Cretaceous event may have triggered the formation of the so-called Darwin Rise superswell in the Pacific. In a recent paper led by one of our ex-students, Madison east, who is now doing a PhD at Cambridge, we proposed that the immense pushing up of the surface in the Cretaceous Pacific ocean actually reflects the large-scale mantle return flow in response to the very fast and voluminous plate subduction in the Early Cretaceous. This upward directed return flow is naturally concentrated in the interior of plates, far away from subduction zones, where the mantle is dominated by downward flow. We find two global highs of this massive upward flow of the mantle, one underneath the central south Pacific, and one centered underneath Africa. These two upwellings even exist today, but in the Early Cretaceous they went into overdrive, pushing the surface up more severely than today.
OS: The seismic tomography shows that after they subduct, the sinking slabs of ocean crust survive all the way down to the core-mantle boundary. When they get down there, could they affect the core, especially, perhaps when the large volume of slabs subducted during a surge like the one in the mid-Cretaceous reach the core-mantle boundary?
DM: Simulations of the geodynamo in the fluid outer core of the Earth suggest that transitions from periods of rapid polarity reversals to periods of prolonged stability — like those that occurred between the Middle Jurassic and Middle Cretaceous periods — may have been triggered by a decrease in core–mantle boundary heat flow either globally or in equatorial regions, which in turn my be related to a change in slab flux reaching the core-mantle boundary. Mantle flow models constrained by our plate reconstructions at the surface can be used to model the history of core-mantle boundary heat flow and its relationship with subduction history. But a plate model over 1 billion years has never been used to test these ideas.
OS: Can the model help us understand changes in the Earth’s climate over geological time?
DM: The disposition of continents and mountains affects ocean and atmospheric circulation. About 750 million years ago, during the period known as the Neoproterozoic, a very unusual configuration of tectonic plates occurred, causing one of the most striking episodes of our planet’s geologic and atmospheric history with the Earth’s surface complete covered by ice – hence the term snowball earth. The process started when the supercontinent Rodinia, formed 1.1 billion years ago, started to break into smaller continental plates. Rodinia was located near the equator, and the resulting continents also remained in the tropics. Rodinia was probably extremely arid because large amounts of moisture could not reach its interior. But when it broke up, the smaller resulting continents had warm and humid climates. This continental configuration accelerated the weathering of rocks at the surface. This process removes large quantities of CO2 from the atmosphere. Carbon dioxide is dissolved in rivers is transported to the oceans, where pelagic organisms like coccoliths use it to make their skeletons. When coccoliths die they fall to the seabed and the associated CO2 gets stored away for a long time. After the supercontinent Rodinia broke up , atmospheric CO2 levels sunk below 200 ppm, less than half our current levels. With this little CO2, ice sheets began to grow, reflected more and more sunlight back to space, cooling the climate even further. Eventually, the whole planet became covered by ice. This brought the continental weathering process to a halt, stopping the mechanism that had previously reduced CO2 in the atmosphere. Volcanism, another byproduct of plate tectonics, is assumed to pump enough new CO2 into the atmosphere to help thaw the ice again. How exactly the feedbacks between tectonics, volcanism and weathering and deep sea sedimentation are tied together is still a very active area of research, which is particularly relevant for understanding possible future pathways of the Earth.
OS: Does this also have implication for the evolution and distribution of life?
DM: Understanding the processes that govern radiation and extinctions of life are closely connected to plate tectonics. Recently, a global fossil data base was connected to paleogeographic reconstructions by Shanan Peters and his collaborators at the University of Wisconsin in the USA. They found that a significant component of the trajectory of marine animal diversity over the past 443 million years can be attributed to the assembly and disassembly of the supercontinent Pangaea, changing the configurations of ocean basins, sea level and modulating the continental area covered by shallow seas. Mountains are another connection between plate tectonics and bioviversity, as originally observed by Alexander von Humboldt. With about 25% of all land area, mountain regions are home to more than 85% of the world’s species of amphibians, birds, and mammals, many entirely restricted to mountains. But such a large region of mountainous area is a relatively recent phenomenon, geologically speaking. The vast majority of today’s large mountain ranges are younger than about 50 million years. This reflects the progressive dispersal of continents after the breakup of Pangea. Now that we are in a mature breakup stage, we are experiencing progressive growth in continental collisions, while for about 150 million years before this time the Earth was relatively flat, but with a high sea level, resulting in biodiversity concentrated in shallow seas rather than mountainous regions. In this fashion, plate tectonic cycles play a major role in modulating biodiversity.
OS: Does the model enable us to run the clock into the future and predict what will happen?
DM: Yes, definitely. A number of researchers, starting with Chris Scotese, who leads the US-based Paleomap project, have worked on future plate tectonic scenarios. The big unkown is whether the Atlantic Ocean will continue to open, or whether a subduction zone will be initiated along one of its margins. The result will be dramatically different. Either the Americas will run into eastern Eurasia some time in the future, or they will join up with Africa again.
OS: If you had unlimited research funds, how would you use them?
DM: I would build a 3D model of the world’s geology, a global stratigraphic database. This would allow us to understand the deep structure of continents, the history of intrusions, the connections between uplift, erosion, and sedimentation, and thus the history between deep Earth dynamics, ie mantle convection, and plate and surface processes through time. Erosion is a killer, because, akin to subduction, the eroded material has been removed. But much of the material eroded on continents is still there, deeply buried in sedimentary basins. If we know the deep structure of global sedimentary basins in better detail, we could build much better virtual Earth models, including models for the carbon cycle. Much of the data that would be needed do exist. They have been collected by exploration companies and include well and seismic reflection data. If one could coordinate industry to pool at least some of these resources for research, and make them available to the community, it would be an enormous boon to better understanding Earth evolution through geological time.
OS: Dietmar Müller, thank you very much.
Listen to the postcast here.